
Based on U.S. congressional public trade disclosure records and historical stock price backtests of the publicly disclosed holdings, as of August 25, 2026, Pelosi's disclosed portfolio holds 16 U.S. stocks, with an estimated cumulative backtest return of about +915%, an annualized return of about +21.41%, and a year-to-date 2026 return of about +297.4%. This article does not track the timing of individual trades; it only examines a more fundamental question: which industry themes this portfolio's money is mainly concentrated in, and what ordinary investors can learn from it and cannot simply copy. All data in this article come from public disclosures and estimated backtests, and are for research reference only, not investment advice.
Portfolio Overview: 16 Stocks, Top Eight Account for Nearly 90%
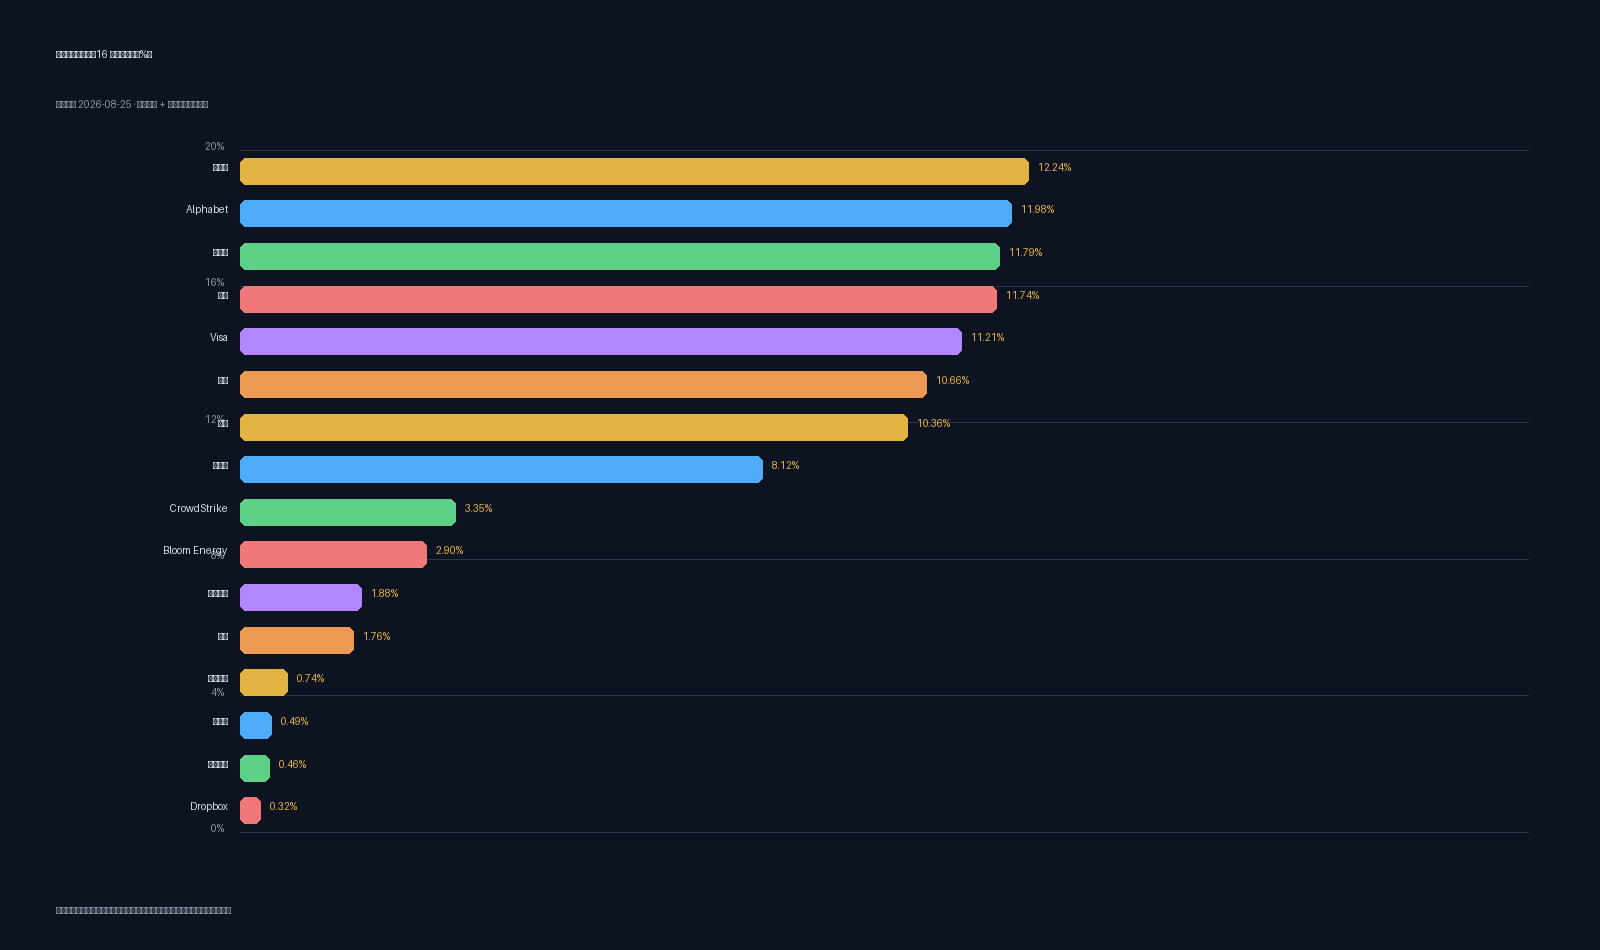
The disclosed portfolio holds 16 stocks, with highly concentrated weights:
- Top five holdings: Amazon 12.24%, Alphabet 11.98%, Nvidia 11.79%, Apple 11.74%, Visa 11.21%;
- Top eight holdings (adding Broadcom 10.66%, Microsoft 10.36%, Salesforce 8.12%) together account for about 88.1%;
- Other positions: CrowdStrike 3.35%, Bloom Energy 2.90%, American Express 1.88%, Netflix 1.76%, Interactive Brokers 0.74%, Intel 0.49%, Comcast 0.46%, Dropbox 0.32%.
The implication of this structure is that the portfolio's returns and drawdowns are mainly driven by a few large-cap technology stocks. Concentration has been both a source of return elasticity over the past decade and a risk amplifier when a single sector moves in unison.
Structure Breakdown: Four Main Themes + Two Satellite Positions
Grouping the 16 holdings by business attribution (weights are the author's own classification based on disclosure data):
- AI compute and semiconductors about 22.9%: Nvidia, Broadcom, Intel—from general-purpose GPUs to custom AI chips;
- Cloud and enterprise software about 18.8%: Microsoft, Salesforce, Dropbox—the "picks and shovels" of AI applications;
- Platform economy about 14.5%: Amazon, Netflix, Comcast—e-commerce, streaming, and broadband cash flows;
- Payments and finance about 13.8%: Visa, American Express, Interactive Brokers;
- Satellite positions: cybersecurity CrowdStrike 3.35%, clean energy Bloom Energy 2.90%;
- Single-point positions: consumer hardware Apple 11.74%, search and advertising Alphabet 11.98%.
Why This Is a Full AI Value Chain Allocation
From an industry chain perspective, this portfolio covers almost the entire AI transmission chain: upstream compute (Nvidia, Broadcom) → midstream cloud platforms (Microsoft, Amazon, Alphabet) → application software (Salesforce) → security (CrowdStrike) → energy (Bloom Energy's clean power logic). This is broadly consistent with the industry transmission sequence of the AI market since 2023: "compute first, then platforms, then applications."
The portfolio's historical trajectory also confirms this main theme: in 2023, when the AI market started, it was heavily positioned in Nvidia and other tech stocks; after 2025, it continued to hold technology and chip stocks, with returns accelerating upward. This looks more like "long-term holding of industry main themes" rather than high-frequency short-term trading.
Three Caveats on the +915% Backtest
The cumulative return of about +915% and the year-to-date 2026 return of about +297.4% are eye-catching, but before using them, you must understand their basis:
- Backtests are not live trading: This figure is an estimated backtest based on publicly disclosed holdings and historical stock prices. The timing of trades, fees, slippage, and position adjustments along the way can all significantly change actual results;
- Disclosure lags: U.S. congressional trade disclosures (STOCK Act) have a reporting window, so what outsiders see is "rear-view mirror" data. By the time ordinary investors see the disclosure, prices often already reflect the information;
- Concentration is a double-edged sword: Concentrated positioning in tech and AI can also amplify drawdowns when styles rotate—the portfolio itself briefly drew down during the 2022 market decline.
What Can Be Learned, What Cannot Be Copied
- What can be learned is main-theme thinking: focus on heavy positioning in industry trends themselves, rather than chasing individual stock news or short-term timing;
- What cannot be replicated is timing and cost basis: disclosure lags, backtest biases, and differences in fees and taxes mean that the returns from "copying the homework" are not comparable to the public portfolio;
- Risk disclaimer: All data in this article come from public disclosures and historical stock price backtests, and are for research reference only, not any investment advice; past performance does not predict future results, and investing involves risk.
Sources and Editorial Notes
- Data basis: U.S. congressional public trade disclosure (STOCK Act) records and historical stock price backtests, data as of 2026-08-25;
- The charts in this article were independently drawn by this site based on disclosed holdings weights, and the industry theme grouping is the site's original compilation;
- Editor: MSX On-chain US Equities Editorial Team.