Data as of the 4th week of September 2026. Key levels are technical reference points in the chart, not price predictions; please refer to real-time market data. This article is only an information compilation and verification framework and does not constitute investment advice.
This Week's Key Levels for the Four Major Indices
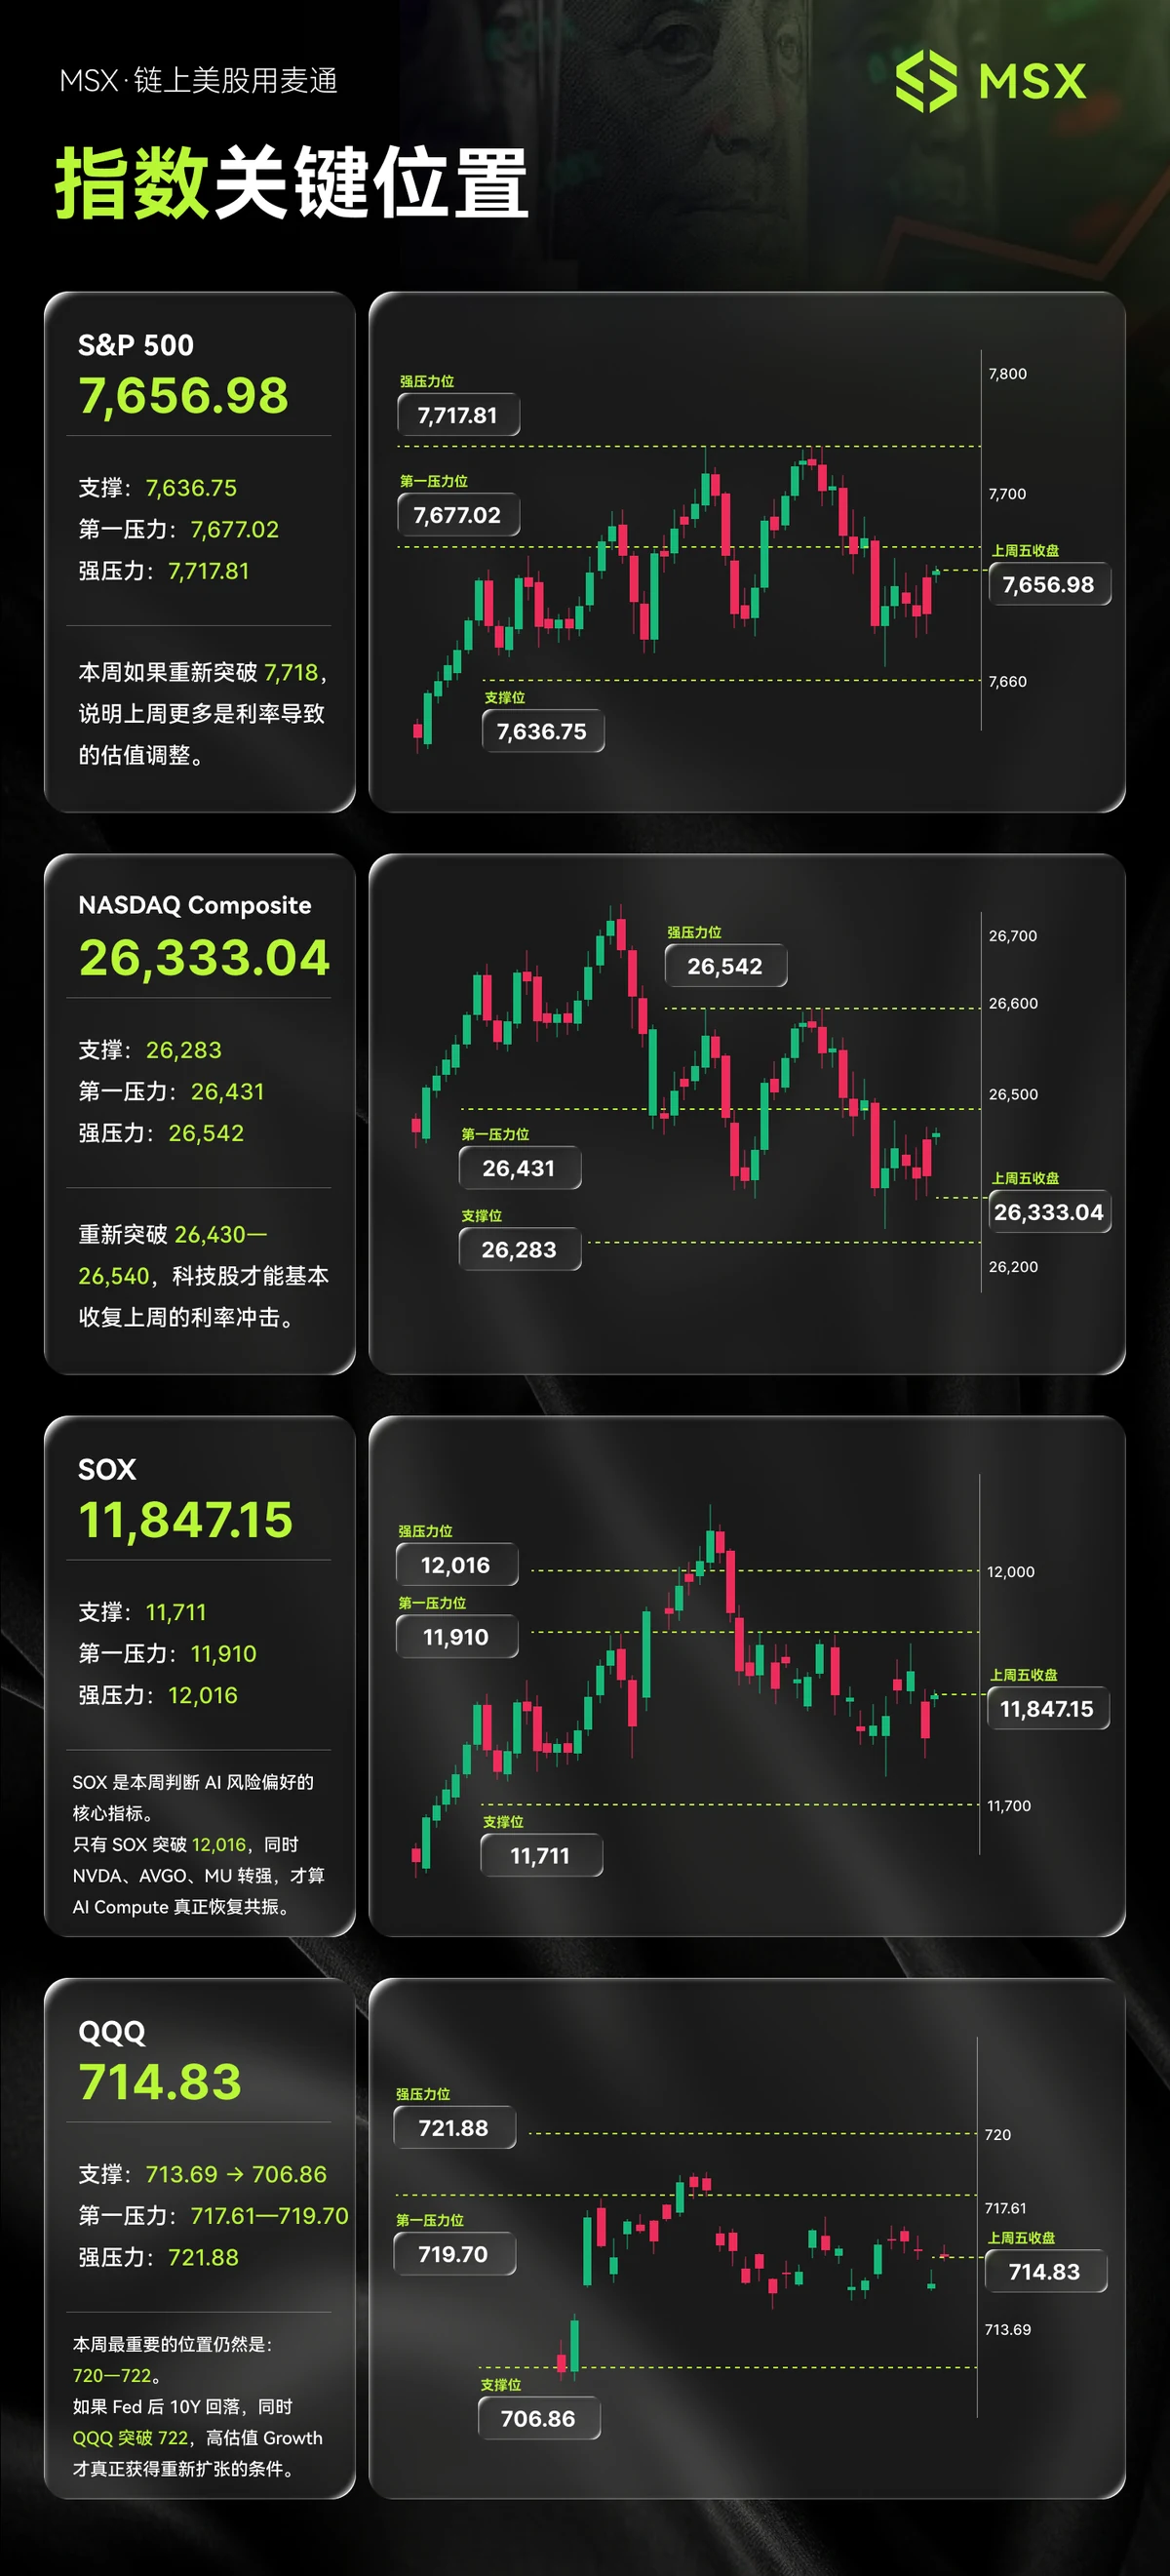
This week's key levels for the four major US indices can be summarized in one sentence: Indices are all at high levels, but divergence has already emerged. The specific figures are as follows:
| Index | Latest Level | Support | Resistance | Strong Resistance |
|---|---|---|---|---|
| S&P 500 | 7,656.98 | 7,636.75 | 7,677 | 7,717.81 |
| NASDAQ | 26,333.04 | 26,283 | 26,431 | 26,542 |
| SOX Semiconductor | 11,847.15 | 11,111 | 11,910 | 12,016 |
| QQQ | 714.83 | 713.69–706.86 | 717.61–719.70 | 721.88 |
(Table data comes from the 4th week of September market chart; specific values are subject to real-time quotes from trading software.)
Three noteworthy details:
- S&P 500 is only about 0.8% away from strong resistance: 7,656.98 is very close to 7,717.81; breaking above opens new space; if it fails to hold above 7,677, it will first test the 7,636.75 support.
- SOX's position is the most delicate: 11,847.15 is close to both resistance at 11,910 and strong resistance at 12,016, while support at 11,111 is about 6% below. The room for error is asymmetric—limited upside and larger downside—so SOX is often regarded as a core indicator of AI risk appetite.
- QQQ is stuck below the 720–722 attack/defense zone: The range between 714.83 and strong resistance at 721.88 is precisely the most noteworthy battle line of this round.
How the 10Y Yield Transmits to High-Valuation Growth: The 5% Threshold Logic
This week's core macro variable remains the 10-year US Treasury yield (10Y). Its transmission chain to high-valuation growth stocks is roughly as follows:
- Rising discount rate: Rising 10Y lifts the risk-free rate, depressing the present value of future cash flows; stocks with high valuations and a large share of long-dated earnings (AI, software, growth sectors) are most sensitive.
- Valuation anchor drift: As the 10Y approaches and attempts to break above the 5% threshold, the market re-evaluates risk premiums, and the premium previously paid for growth begins to shrink.
- Style rotation: High interest rates push funds to rebalance between value/defensive and growth; even if AI fundamentals are unchanged, valuation multiple fluctuations can amplify index volatility.
After last week's FOMC, the core question the market focuses on is whether the 10Y effectively breaks above 5%: if it holds above 5%, valuation pressure on high-valuation Growth persists; if it spikes and then retreats, the AI sector has the greatest rebound elasticity. Whether this week's key levels can be realized depends half on the 10Y's performance near the 5% threshold.
Conditions for SOX and AI Hardware Resonance (NVDA / AVGO / MU)
SOX is the most direct 'thermometer' for the AI hardware chain. To judge whether SOX forms upward resonance with AI hardware, look at three conditions:
- Leading stocks aligned: Computing power leaders such as NVDA and AVGO do not make new lows and move upward on rising volume;
- Storage cycle coordination: Memory stocks such as MU (Micron) act as cyclical amplifiers, and their stock price action can confirm SOX's test of the 11,910 resistance;
- Breadth intact: When SOX rises, the number of advancing constituents expands simultaneously, rather than being supported by only a few heavyweight stocks.
Conversely, if SOX fails to hold above 11,910 or even breaks below the previous low, it indicates that risk appetite in the AI hardware chain is contracting, and index-level strength should be viewed with a discount.
The Significance of the QQQ 720–722 Attack/Defense Zone
The QQQ 720–722 area is an observation point where 'AI heavyweight stocks + growth style' intersect:
- Above: Once strong resistance at 721.88 is effectively broken, the growth style regains momentum, and large-cap AI heavyweight stocks (usually among QQQ's top ten holdings) will lead the rally;
- Below: 713.69–706.86 are two support levels. If they are lost consecutively, it indicates that funds are retreating at high interest rates, and the depth of the pullback will significantly expand;
- Verification method: Use both 'closing price + volume' to confirm a breakout or breakdown; a single-day wick is not considered a valid signal.
Combined with the 10Y's movement near the 5% threshold, QQQ 720–722 can serve as a real-time indicator of whether the 'interest rate → growth stocks' transmission holds.
Last Week's Key Levels Review and Verification
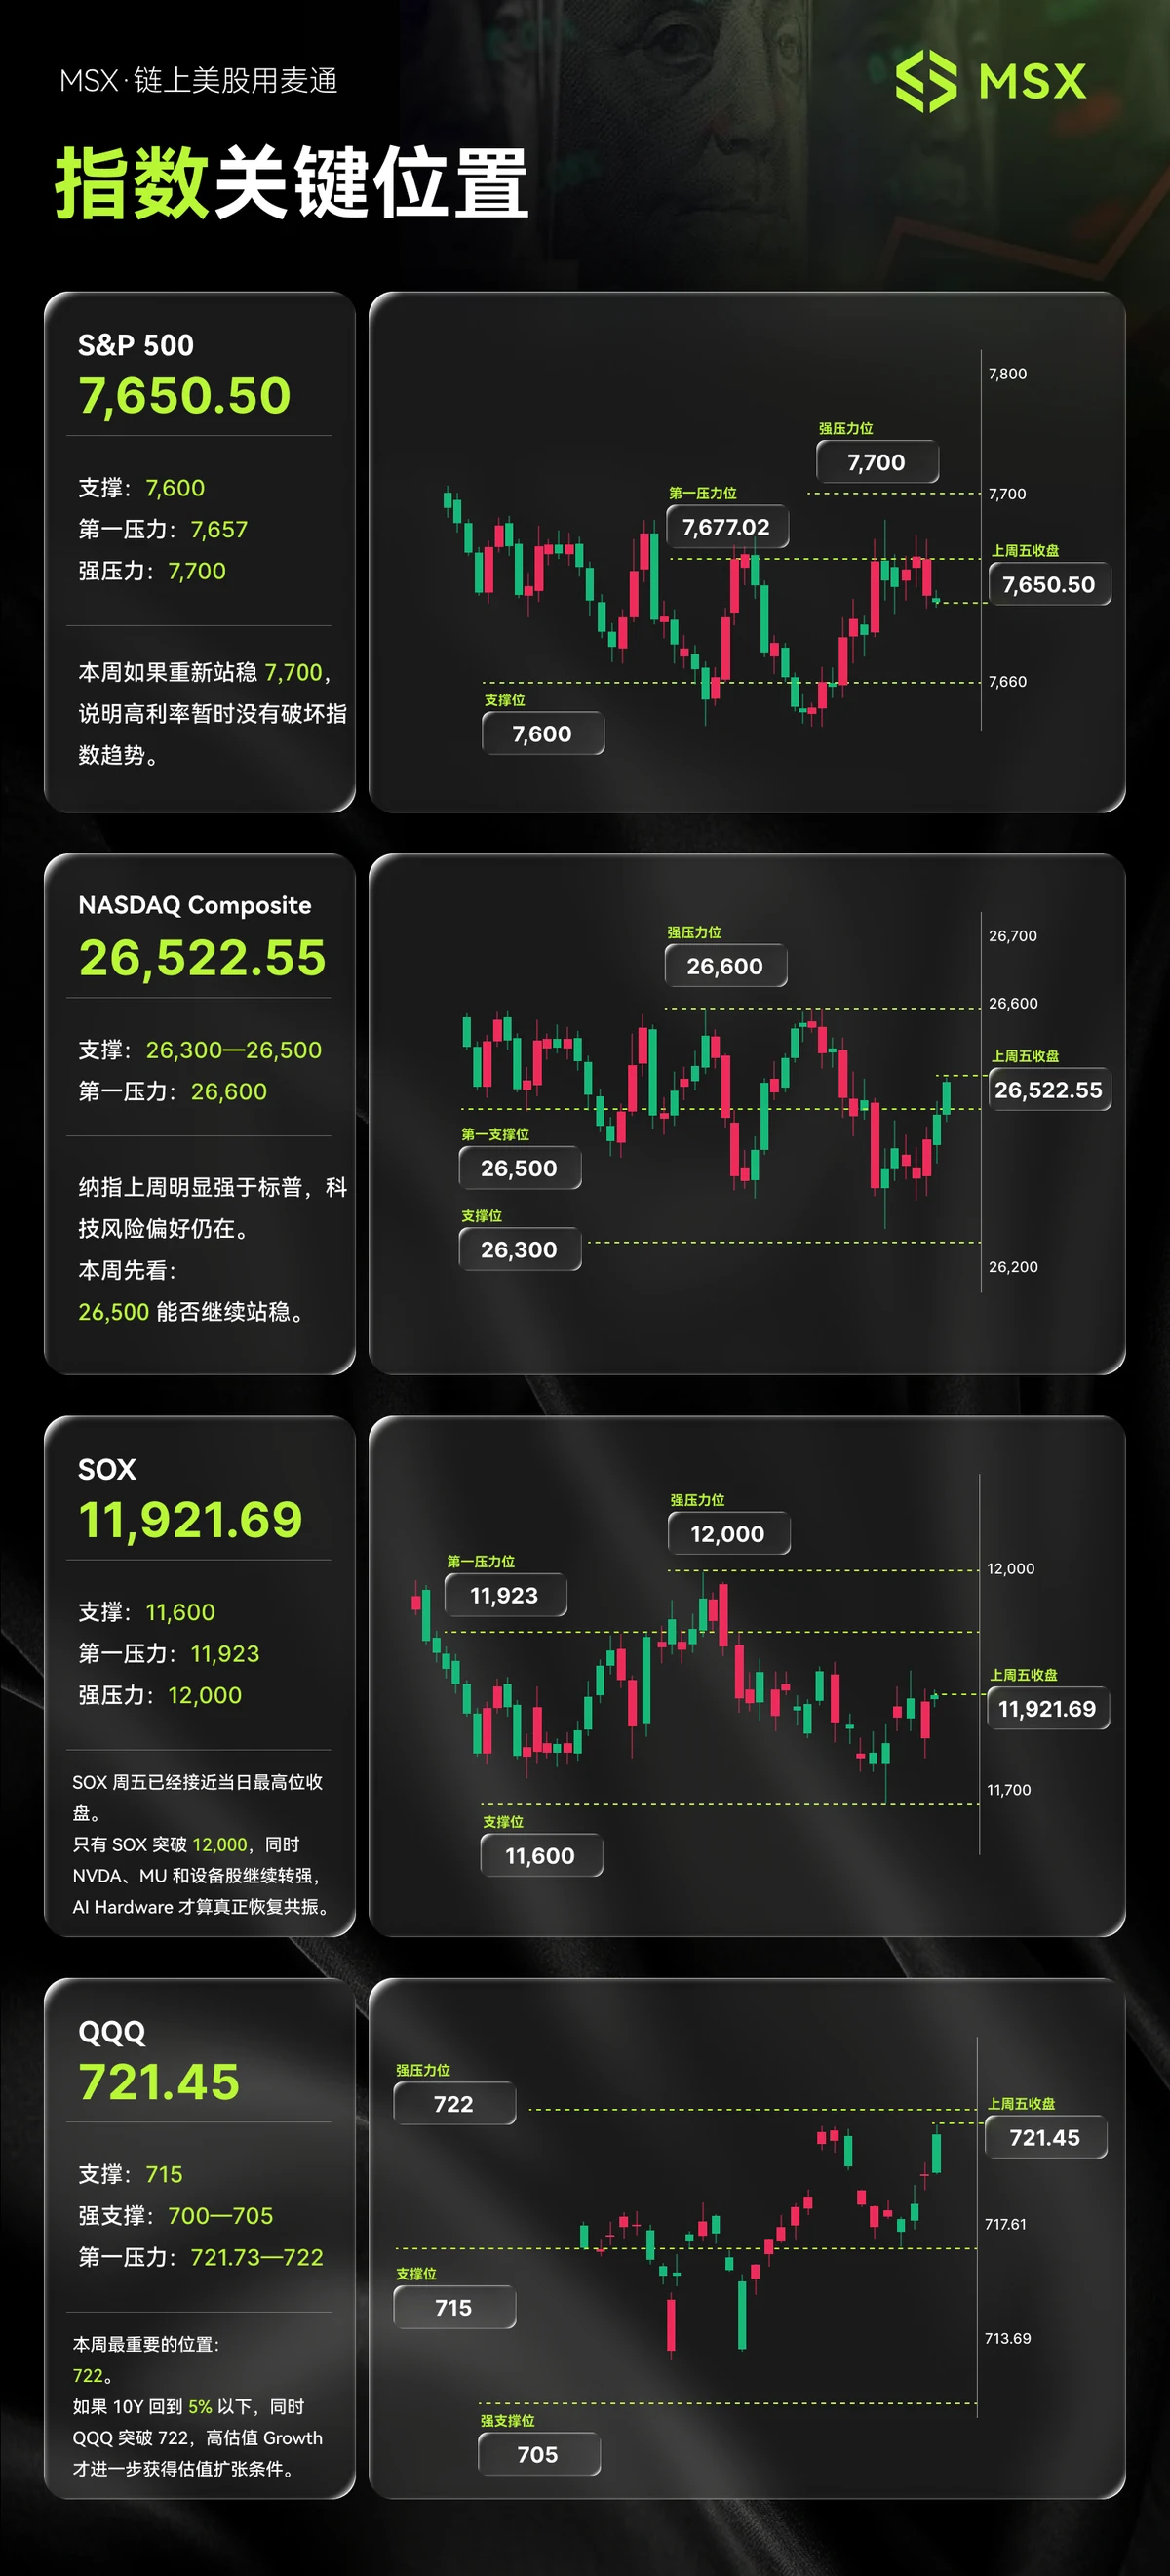
Comparing the previous week's version with this week's chart, you can see which key levels were realized and which failed:
| Index | Last Week's Level | This Week's Level | Comparison Interpretation |
|---|---|---|---|
| S&P 500 | 7,650.50 | 7,656.98 | Basically flat, still between support and resistance |
| NASDAQ | 26,522.55 | 26,333.04 | Fell about 0.7%, approaching the 26,283 support |
| SOX | 11,921.69 | 11,847.15 | Fell about 0.6%, breaking below the 11,910 resistance |
| QQQ | 721.45 | 714.83 | Fell about 0.9%, back below the 720–722 attack/defense zone |
(Last week's and this week's data are both from the corresponding weekly market charts, for comparison only, not for prediction.)
Review conclusion: Last week's decline in SOX and QQQ indicates that before the 10Y provides direction, the market's willingness to chase high-valuation AI is limited; this week's focus is on whether these key levels can reorganize in the face of data and interest rate news.
How to Use Tokenized US Stocks on MSX to Position in Indices and Individual Stocks
For those accustomed to on-chain assets, there is another way to execute on the above key levels: use tokenized US stocks to allocate to index-related instruments or individual stocks on MSX. The basic path:
- First build a watchlist: Organize the key levels of S&P 500, NASDAQ, SOX, and QQQ into a table (you can directly use this article's table), and annotate the trigger conditions for each level.
- Test liquidity in small amounts: On MSX, first buy the target tokenized instrument in the smallest unit to confirm that order placement, execution price, and on-chain arrival time meet expectations.
- Batch rather than all at once: Split the planned amount into 2–3 tranches, executing each only after the key level is confirmed, to avoid putting in the entire amount on a false breakout.
- Record on-chain costs: Include USDT deposits, trading fees, possible slippage, and withdrawal costs; evaluate profit and loss using 'actual received cost' rather than nominal price.
Note: Tokenized US stocks are still affected by the volatility of the underlying US equities, with additional layers of on-chain liquidity, platform rules, and compliance differences, so risk is higher than traditional brokerage trading. Any key level is only an observation framework, not a trading instruction.
Disclosure: The MSX and tokenized US stocks mentioned in this article are introduced as content collaboration/conversion scenarios. Before trading, please verify the platform's qualifications, fees, and local regulatory requirements yourself; data is as of the 4th week of September 2026, subject to real-time market conditions. This article does not constitute investment advice.