Queries for 2026 RWA sector market cap rankings often encounter three asset classes—tokenized US equities, tokenized US Treasuries, and commodity protocols—compared side by side. This article does not prefill specific rankings; instead, it provides market cap calculation standards, comparison dimensions, and primary-source verification paths for these three asset classes. Specific rankings should be based on same-day snapshots from platforms such as CoinGecko and DefiLlama on the date the reader opens the page.
2026 RWA Market Cap Ranking Verification Methods: Comparison Dimensions for Tokenized US Equities, Treasuries, and Commodity Protocols
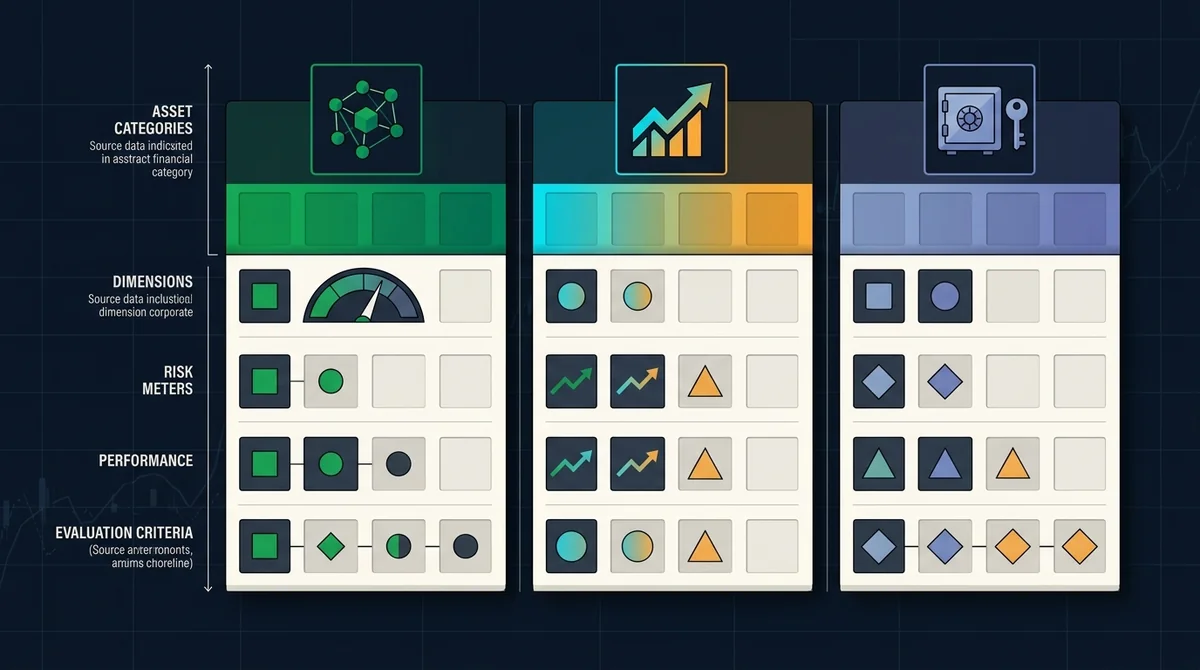
In 2026 RWA token market cap rankings, tokenized US equities, tokenized US Treasuries, and commodity protocols are often compared in the same table, but they are not fully comparable. The table below explains the fields that need to be verified for each. 'To verify' in the table indicates that a primary-source snapshot has not yet been obtained, and figures are not prefilled.
| Comparison dimension | Tokenized US equities | Tokenized US Treasuries | Commodity protocols |
|---|---|---|---|
| Circulating market cap / fully diluted market cap | Verify token price and circulating supply; distinguish circulating market cap from FDV | Verify on-chain Treasury token supply and price snapshot | Verify commodity token price and reserve/circulating supply |
| Underlying asset class | Verify US equity depositary receipt / stock token underlying asset | Verify underlying Treasury maturity, issuer, and maturity date | Verify underlying commodity (e.g., gold) and custody proof |
| Compliance and collateral structure | Verify issuer, custodian bank, and regulatory registration | Verify compliant issuance, collateral, and audit | Verify custodian, on-chain proof of reserves, and audit |
| Data source and cutoff date | CoinGecko/DefiLlama snapshot | Same as left | Same as left |
Market Cap Calculation Standards
When verifying RWA token market cap rankings, readers should record circulating market cap and fully diluted market cap separately. Tokenized US equities typically calculate circulating market cap as token price multiplied by circulating supply, while also considering fully diluted market cap. Tokenized US Treasuries should start from the circulating supply and price snapshot of Treasury tokens and cannot be directly compared with equity market caps. Similarly, tokenized Treasury rankings should not look only at market cap; underlying debt maturity and collateral structure must also be considered.
On-chain Asset Classes
The underlying assets of these three classes differ: tokenized US equities correspond to US equity interests or depositary receipts, tokenized US Treasuries correspond to US Treasuries or related bonds, and commodity protocols correspond to physical commodities or their on-chain rights. Before comparing rankings, readers should first place each project into the correct category, avoiding directly mixing commodity market caps with equity market caps.
Compliance and Collateral Structure
For tokenized US equities, compliance focuses on stock custody and regulatory registration; for tokenized US Treasuries, verify the issuer, collateral, and audit reports; for commodity protocols, also confirm on-chain proof of reserves and the custodian. These structural details affect the credibility of market cap data but usually are not directly reflected in the market cap number.
Data Sources and Cutoff Date
When verifying, readers should primarily use CoinGecko's RWA category or DefiLlama's protocol market cap page, record the statistical cutoff date, and compare snapshots for the same batch of projects at the same point in time whenever possible. Whether looking at crypto rankings or RWA category filters, the statistical cutoff date should be recorded to avoid treating data from different points in time as equivalent. If you are interested in tokenized US equity platform selection, you can further read this site's 2026 Tokenized US Equity Platform Rankings: USDT Purchases, Compliance, and Fee Comparison.
Data Standards, Sources, and Boundaries
At the time of writing, no verifiable market cap, token price, or circulating supply data was obtained, so no specific rankings or figures are listed. All rankings and market caps should be based on same-day snapshots from primary sources such as CoinGecko and DefiLlama on the statistical date.
Unknown or unverified items: As of publication, the MSX RWA editorial team has not obtained verifiable market cap data for representative projects across the three protocol types. Specific representative projects, market cap figures, and rankings must be verified by readers using primary sources.
Relevance statement: This article only provides a side-by-side comparison and methodology explanation for the three asset classes; it does not claim that any class's market cap movement was caused by a single event. Existing public information does not confirm a direct causal relationship between the relevant assets, and any interpretation of a particular class rising or falling requires additional evidence.
Risk warning: Crypto/digital asset prices are highly volatile, and information and rules may change at any time. This article does not constitute investment, legal, or tax advice. Before making decisions, refer to the latest official announcements and actual product pages. When assessing the safety of RWA investments, you may refer to this site's "Is Investing in RWA with U Safe? Risk, Compliance, and Safe Investment Guide (2026 Verification)".