
Core Summary: On September 5, 2026, Bitcoin fell to $79,599 and Ethereum to $2,455, but the previous day (September 4) U.S. spot ETFs still recorded net inflows, while short-term holders transferred large amounts of BTC to exchanges, creating selling pressure. ETF institutional buying and holders taking profits together formed a short-term tug-of-war between bulls and bears. Crypto market volatility may transmit to MSX on-chain U.S. equities through risk appetite, but specific instruments need to be verified for correlation one by one. Data in this article is as of September 5, 2026 and does not constitute investment advice.
Intraday Market and Core Contradiction: ETF Inflows vs. Short-Term Holder Selling Pressure
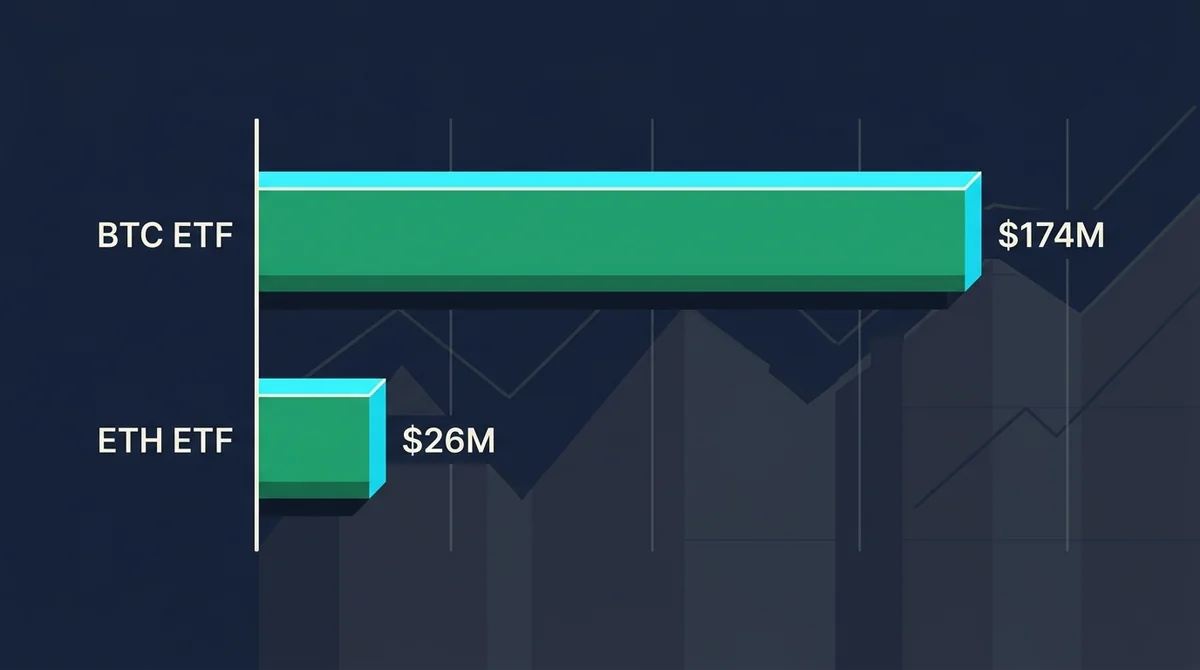
According to TokenPost on September 5, 2026, Bitcoin fell 1.75% to $79,599 and Ethereum fell 2.45% to $2,455. Spot ETF flows disclosed the same day for September 4 showed net inflows of $174 million for Bitcoin spot ETFs and $26 million for Ethereum ETFs. The coexistence of price declines and inflows shows that a single fund flow indicator is insufficient to determine short-term direction.
CryptoQuant data shows that since August 17, short-term holders transferred 467,000 BTC to exchanges, worth about $35.4 billion, with average daily exchange transfers of 27,500 BTC, 29% higher than the average of the previous three months. This selling pressure comes from addresses with shorter holding periods and may be related to profit-taking, offsetting the price support from ETF buying. Related reading: Bitcoin Holds $81,000: September 3 ETF Flows and FHFA Crypto Mortgage Interpretation.
Our Independent Assessment: ETF net inflows represent institutional allocation demand, but BTC supply flowing into exchanges may dominate pricing in the short term. If selling pressure continues, crypto market volatility may spill over through risk appetite, but the direction and magnitude of transmission to tokenized U.S. equities need to be verified in combination with underlying U.S. equities and liquidity.
How Fed Policy Expectations Amplify Volatility: August Nonfarm Payrolls and September FOMC
The U.S. August nonfarm payrolls report showed 162,000 new jobs. Prediction markets priced a 50% probability of a 25 basis point rate hike at the Federal Reserve's September 16 FOMC meeting and a 50% probability of keeping rates unchanged. An unclear policy path can amplify volatility in risk assets such as crypto assets and tokenized U.S. equities.
According to TokenPost, after the data release, market pricing for a September rate hike was evenly split. If subsequent inflation or employment data changes expectations, crypto markets may quickly reprice, and users holding MSX on-chain U.S. equities should also watch the same macro window.
Technical Key Levels: ETH 200-Week EMA and BTC Key Range
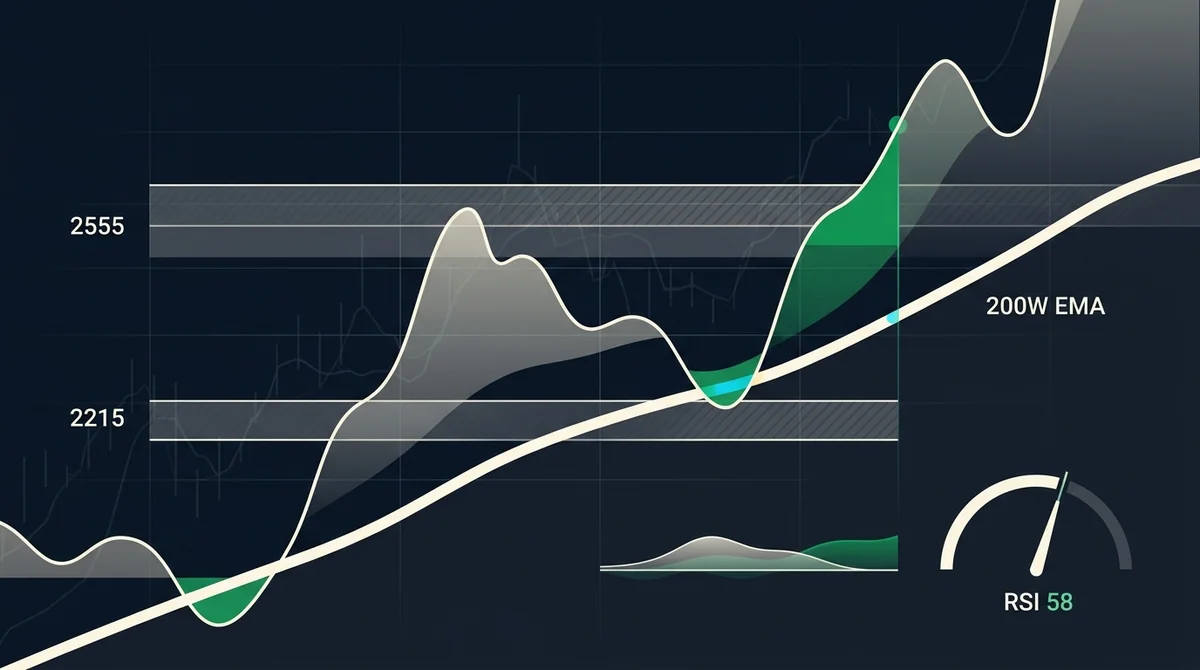
Ethereum is testing the 200-week EMA around $2,455, with resistance at $2,555 and support at $2,215, and RSI at 58. These technical levels reflect the market's struggle over Ethereum's medium-term trend; if it breaks below the 200-week EMA, it may accelerate toward the $2,215 support.
Kalshi traders expect Bitcoin to rebound to at least $82,000 in September, with a chance to reach $85,000; BTC was trading around $79,000 at the time. Our Independent Assessment: Prediction market data is only probability pricing by market participants, not a price guarantee, and stands in contrast to short-term holder selling pressure, so it should not be used as the sole basis for action.
How These Signals Map to MSX On-Chain U.S. Equity Operations
The impact of crypto market volatility on MSX on-chain U.S. equities is mainly reflected in risk appetite and liquidity expectations, rather than direct price linkage. Users can refer to the following verification steps:
- Confirm data timing: Price and ETF inflow data are as of 2026-09-05, with ETF inflows being September 4 data.
- Verify on-chain selling pressure definitions: CryptoQuant's definition of "short-term holders" and its exchange transfer statistics method need to be double-checked from the original source.
- Watch macro event windows: The August nonfarm payrolls have been released, and the September 16 FOMC policy outcome and prior official speeches may change volatility.
- Use technical levels as probability references: ETH's 200-week EMA, $2,555/$2,215, and RSI 58 are only for judging the bull-bear structure and are not buy or sell instructions.
- Map risk for MSX on-chain U.S. equity positions: Retrieve the correlation between specific tokenized U.S. equity instruments and their underlying U.S. equities, trading hours, liquidity, and compliance information; verify each item before deciding position duration and diversification.
Our Independent Assessment: ETF inflows reflect institutional allocation demand, while short-term holder selling pressure reflects profit-taking; both jointly affect risk appetite. MSX on-chain U.S. equity traders should first verify the mechanical differences between underlying U.S. equities and tokenized products, rather than directly copying conclusions from the crypto market. Related reading: Why Did the Crypto Market Fall Today? Labor Day Liquidity Gaps and Profit-Taking Double Pressure.
Data Definitions and Verification: How to Avoid Being Misled by Short-Term Noise
This report's price and ETF inflow data are as of 2026-09-05, with ETF inflows being September 4 data; short-term holder on-chain data comes from CryptoQuant, whose holder classification and transfer definitions need to be verified; Kalshi predictions are market probabilities and do not constitute a future price guarantee.
All external data comes from TokenPost reports in the input source (September 5, 2026) and does not include any unverified specific instruments or features on the MSX platform. To determine whether a particular tokenized U.S. equity is affected by crypto volatility, you should review the underlying U.S. equity's financial reports, liquidity provision mechanism, and compliance disclosures, rather than relying on a single crypto market indicator. Related reading: Title Claims Bitcoin Broke $96,750 but Body Says Only $79,848: Price Contradiction and Coinbase, SOL Verification Guide (MSX User Perspective).
Risk Warning: Crypto/digital asset prices are highly volatile, and materials and rules may change at any time. This article does not constitute investment, legal, or tax advice. Before making decisions, refer to the latest official announcements and actual product pages.