On January 15, 2026, a Decrypt video page headline claimed Bitcoin broke above $96,750, but the price list in the body of the same page showed BTC at $79,848.00, down 0.16% on the day. The two prices differ by about $16,902, indicating a clear discrepancy. This article first breaks down the source of the difference, then provides Bitcoin price verification steps based on Coinbase and an independent market data source, and finally explains how MSX users can apply the same method to tokenized U.S. stock price verification. This article does not constitute investment advice.
Price Discrepancy Breakdown: Sources of the Difference Between the $96,750 Headline and $79,848 Body
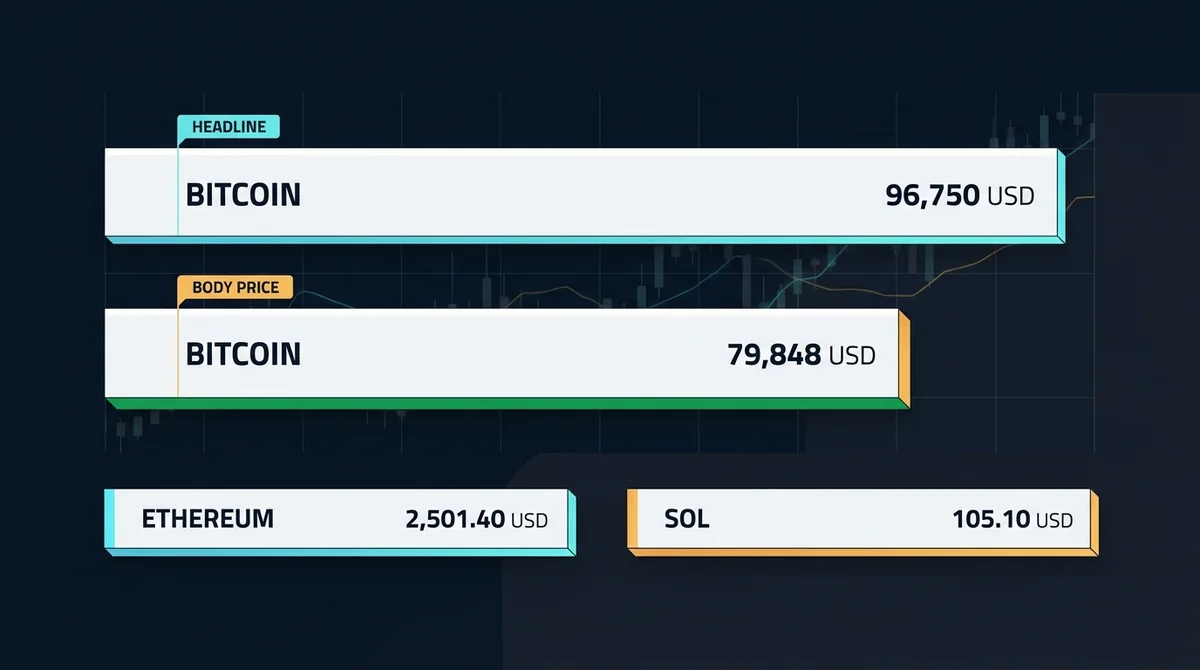
According to the Decrypt material (captured at 16:49:34 UTC on January 15, 2026), the page title was "Massive Coinbase News: Bitcoin Rips to $96,750," while the crypto price list in the body showed BTC at $79,848.00, down 0.16% on the day. The same list also showed ETH at $2,501.40, down 0.02%, and SOL at $105.10, up 1.22%. The headline and body differ by about $16,902 for BTC, but ETH and SOL did not show a similar discrepancy.
Possible sources of this discrepancy include: the headline used a price from a different point in time or a different trading pair, the price list was not updated in sync, or stale data was introduced during editing. Regardless of the cause, readers should not make judgments based solely on the headline figure.
What Do the Headline and Body Actually Say?
The headline claims Bitcoin "rips to $96,750," which typically implies a rapid breakout. The body price list provides more complete data for three assets: BTC $79,848.00, -0.16% on the day; ETH $2,501.40, -0.02%; SOL $105.10, +1.22%. All of these figures come from the same page capture.
Why Does the Body Have a Full Price List While the Headline Shows a Different Number?
Possible reasons include: the headline writer used an earlier or later BTC price, while the body price list comes from an auto-updating source but lagged; the $96,750 in the headline may come from a very short-lived peak, while the body's $79,848 was the regular quote at the time of capture; or the editor may have failed to proofread the body after publishing the headline. In any case, the price discrepancy shows that users need multi-source verification.
Verification Step 1: How to Confirm the Real BTC Price Using Coinbase and an Independent Market Data Source
To confirm the real BTC price, prioritize timestamped real-time market data sources. Cross-verification between Coinbase and an independent source is a common verification method. The following steps do not provide a specific real-time price, because prices may have changed by the time of writing; instead, they provide a repeatable process.
Check the Coinbase BTC/USD Real-Time Price
- Open the Coinbase BTC/USD page.
- Record the current query time, accurate to the minute.
- Record the BTC/USD price and intraday change shown on the page.
- Save a screenshot as time-stamped evidence.
Cross-Verify with a Second Independent Market Data Source
- Choose at least one independent market data source, such as another exchange or crypto data platform.
- Query the BTC/USD price at the same point in time.
- Compare the price difference between the two sources. Normally, the spread between major spot markets is small, but the difference between $96,750 and $79,848 exceeds typical spreads, indicating that one of the figures is likely not the spot price at that time.
- Compare the $79,848.00 from the material body with your query results to determine whether that figure is outdated.
Coinbase news fact-checking requires confirming the causal relationship between the news and price changes. The headline mentions "Massive Coinbase News," but you should not simply assume it caused the Bitcoin price change; you must first verify the news content and the chronological order of the price movement.
Verification Step 2: Same-Source Check for SOL's +1.22% Intraday Rise and ETH's Decline
In the material body, SOL is reported at $105.10, up 1.22% on the day, and ETH at $2,501.40, down 0.02%. When verifying these two data points, query the same market data source at the same point in time and confirm the calculation method for the percentage change.
Can SOL's $105.10 and +1.22% Intraday Gain Be Verified?
It can be verified, but you need to go back to a market data source around 16:49 UTC on January 15, 2026. If the SOL price and intraday change you currently see differ significantly from the material, it may be due to the time window. For example, if the material timestamp is several days old, the +1.22% intraday gain is no longer applicable. Therefore, Solana's +1.22% intraday gain is only a historical snapshot and does not represent current performance.
What Does ETH at $2,501.40 and -0.02% Intraday Mean?
ETH's intraday decline was extremely small and essentially flat. This shows that Ethereum was relatively stable at the time of capture. Compared with SOL's +1.22%, ETH's negative value may be a tiny rounding-driven fluctuation. If a market data source at the same point in time shows a positive or significantly different ETH intraday change, you should question the update time of the material's price list.
MSX User Perspective: Transferable Methods for Tokenized U.S. Stock Holdings and Price Verification
MSX RWA is an independent third-party media outlet and does not provide real-time quotes or trade execution, nor does it represent MSX officially. When managing tokenized U.S. stock holdings, users can apply the verification methods above: record the source, timestamp, and quote methodology; prioritize cross-confirmation with multiple traceable public data sources; and do not treat a single figure in media material as the final fact. For prices related to earnings or positions, keep at least one citable source and avoid using unverified figures directly in trading decisions. To review basic Bitcoin concepts, see "Bitcoin and Blockchain: A Basic Explanation of Decentralized Digital Assets."
Tokenized U.S. stocks are generally pegged to the underlying stock price, but on-chain trading may be affected by liquidity. Users should confirm the price formation mechanism for tokenized U.S. stocks on their own, as it may differ across platforms. In any case, do not skip independent verification and place an order directly.
Common Mistakes, Risks, and Verification Principles
In price verification, several common mistakes should be avoided: placing orders based solely on headlines, ignoring material timestamps, and confusing spot prices with index prices. These mistakes can cause users to bring incorrect prices into their decisions.
Placing Orders Based Solely on Headlines
Headlines usually aim for impact and may use a price from a very short time window. If you place an order after seeing only $96,750, you could be seriously misaligned with the $79,848 in the body. The correct approach is to first check the body price list, then verify the real-time quote. Users should not blindly buy Bitcoin without verifying the price.
Ignoring Material Timestamps
The material for this article was captured at 16:49 UTC on January 15, 2026, and prices may have changed by the time of writing. All price figures have a time window, and outdated figures cannot be used for real-time decisions. Users should record the time of their own query and compare it with the material time. For a more systematic risk monitoring checklist, see "Bitcoin Falls Below the 200-Week Moving Average in 2026: A Risk Monitoring Checklist from the Federal Reserve, Japanese Bonds, and ETF Flows."
Confusing Spot Prices with Index Prices
Different platforms may show spot, index, or weighted average prices, and the differences can be large. When verifying, you must first standardize the methodology, or choose the same trading pair, the same time point, and the same data source. If the methodology is inconsistent, even similar price figures can mislead decisions.
This article is based on a single Decrypt source and is intended only to illustrate a price verification method; it does not constitute buy or sell advice. Users should verify all prices and news sources on their own before making any holding or trading decisions.