MSX RWA Editorial Team Guest Columnist @MSXRWA 2026 This article is about 5,200 words; reading the full text takes about 9 minutes.
Key Data at a Glance

| Asset | Metric | Value | Comparison/Notes |
|---|---|---|---|
| VICI Properties | Dividend yield | 8.12% | — |
| VICI Properties | Price/AFFO | 9.2x | 8-year average 13.92x |
| VICI Properties | Bull-case target price | $38.90 | Author forecast, not realized |
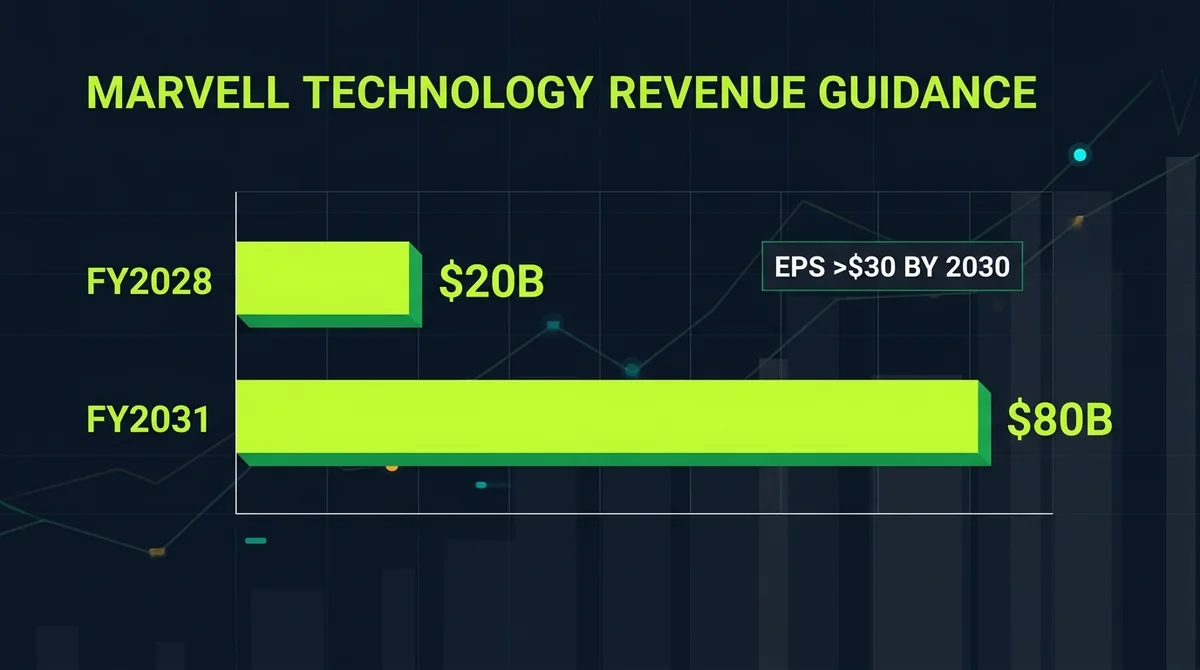
| Marvell Technology | FY2028 revenue guidance | $20 billion | Raised |
| Marvell Technology | FY2031 revenue target | $80 billion | Target, not realized |
| Marvell Technology | FY2030 EPS guidance | Over $30 | If realized |
1. VICI Properties: 8.12% Dividend Yield and 9.2x AFFO Valuation Discount
1. Dividend Yield 8.12%: Trading at 9.2x AFFO, Far Below the 8-Year Average of 13.92x
According to a Seeking Alpha article published on October 7, 2026, VICI Properties currently has a dividend yield of 8.12% and trades at 9.2 times adjusted funds from operations (AFFO). This multiple is not only significantly below the 8-year average of 13.92x, but also far below the typical valuation range for the REIT sector. For a net-lease REIT with stable leases and long-term cash flows, a 9.2x AFFO means the market is willing to pay only $9.2 for each $1 of AFFO, while the average willingness over the past eight years was close to $14. This discount magnitude itself is a signal: in a rising interest rate environment, the market's pricing benchmark for dividend-type assets has shifted.
This data point is not an isolated change in positioning but the result of a tug-of-war between asset-side cash flows and liability-side interest rates. A compression in the AFFO multiple is not necessarily a deterioration in fundamentals; it may also be the result of a higher discount rate. According to source_facts, the current valuation is significantly below the historical average. This fact cannot be directly interpreted as a buy signal, but it can serve as a starting point for observing value opportunities. Independent judgment from this site: In the absence of evidence of tenant defaults or rent reductions, it is not rigorous to simply view the 9.2x multiple as 'fundamental deterioration'; a more likely explanation is that interest-rate-sensitive capital has flowed out of high-dividend sectors.
2. The Valuation Discount Means the Market Is Pricing VICI's Risks Significantly Higher Than the Historical Norm
The market's pricing of VICI's risks is clearly higher than the historical norm, as evident from the gap between 9.2x and 13.92x. The same Seeking Alpha article mentions that the author believes the risks are overstated and gives a Strong Buy rating. Here it is important to note that the rating is the author's opinion, not a fact. The Seeking Alpha article author assigns VICI Properties a Strong Buy rating and sets a bull-case target price of $38.90, implying more than 70% upside. This target price is the author's estimate based on their model, not a realized fact.
The valuation discount may stem from multiple factors: rising interest rates directly raise the discount rate, concerns about the cyclicality of the casino industry, and some capital reducing REIT exposure in asset allocation. However, these attributions have not been item-by-item confirmed in source_facts, so they can only serve as a possible explanatory framework. Independent researcher perspective: When a REIT's AFFO multiple compresses from 13.92x to 9.2x while the dividend yield remains at 8.12%, the market is effectively paying a risk premium for 'higher rates for longer.' Whether this premium narrows depends on the subsequent rate path and the realization of the company's payout capacity.
2. Seeking Alpha Strong Buy Rating: $38.90 Bull-Case Target Price and Over 70% Upside
1. Institutional View: Strong Buy Rating Anchors a $38.90 Bull-Case Target Price
According to the Seeking Alpha article of October 7, 2026, the author gives VICI Properties a Strong Buy rating and sets a target price of $38.90. If this target price holds, it implies more than 70% upside from current valuation levels. It should be noted that this 70% upside is the author's estimate based on their model, not a realized fact. The target price itself is a predictive view; investors should distinguish between 'fact' and 'forecast' when reading.
The phrase 'strong buy amid overstated risks, rich capital appreciation and dividends' in the article's title indicates the author's framework: the market is overpricing VICI's risks, while the combination of capital appreciation and dividend returns is attractive. This logic echoes the valuation discount in Section 1: it is precisely because the 9.2x AFFO is significantly below the historical norm that the author believes the upside has opened up. Independent judgment from this site: In information dissemination, a Strong Buy rating is easily simplified into 'will inevitably rise,' but any rating needs to be assessed in conjunction with one's own risk tolerance and time horizon; institutional opinions cannot be directly equated to market outcomes.
2. From Discount to Target Price: Over 70% Upside Corresponds to Valuation Repair and Capital Appreciation
The core logic of this target price is that the current valuation discount provides a high margin of safety and capital appreciation potential. The Seeking Alpha author ties 'Strong Buy' to 'dual returns from capital appreciation and dividends,' meaning that even if valuation repair is slow, the 8.12% dividend yield itself can provide holding returns. This view implicitly assumes that VICI's dividend payments will not be forced to be cut due to a deteriorating rate environment.
Independent judgment from this site: At an AFFO multiple of only 9.2x, if the company's fundamentals hold, the dividend yield and potential valuation repair may form a 'dual engine'; however, whether the target price is realized depends on a turning point in interest rates and a recovery in the market's risk appetite for REITs, and cannot be taken as a certain outcome. The market's pricing of 'more than 70% upside' is actually option value—only when rates start to fall or asset-side cash flows exceed expectations will this space truly convert into gains.
3. Marvell Technology: $80 Billion Fiscal 2031 Revenue Target and Over $30 EPS in 2030
1. Fiscal 2028 Revenue Guidance Raised to $20 Billion: A Clear Anchor for Medium-Term Growth
According to a Seeking Alpha report on October 7, 2026, Marvell Technology raised its fiscal 2028 revenue guidance to $20 billion. The figure of $20 billion for fiscal 2028 is a significant step up from the current revenue base, reflecting the company's optimism about data center and AI-related demand. This guidance was issued by company management and is a fact. Judging from the direction of the guidance adjustment, Marvell did not scale back expectations due to AI hardware demand fluctuations; instead, it chose to raise them, indicating that its order visibility or product mix is improving.
Raising revenue guidance has dual implications for growth stock pricing: on one hand, it provides a trackable anchor for the revenue path over the next four years; on the other hand, it places higher demands on the company's production capacity, supply chain, and ability to deliver customized products. Independent researcher perspective: The $20 billion fiscal 2028 guidance is more like a 'medium-term milestone' than an ultimate ceiling. If data center and AI-related demand continue to expand at the current pace, this guidance could be revised upward again; but if AI capital spending sees a phase of slowdown, the market's tolerance for tech stock valuations will also decline accordingly.
2. Fiscal 2031 Revenue Target of $80 Billion: A Key Assumption for the Long-Term Growth Curve
Marvell further sets a fiscal 2031 revenue target of $80 billion. Moving from $20 billion to $80 billion means revenue could grow threefold within four years, a very aggressive long-term assumption. We do not have detailed forecasts beyond source_facts, so we avoid giving a specific compound annual growth rate. Qualitatively, this is not only management's growth commitment but also a long-term bet on AI computing network demand. It should be noted that $80 billion is a target, not a realized result, and the article title 'Marvell projects 80 billion in revenue but I'm not buying' suggests not all authors agree.
Long-term revenue targets are not uncommon in the US tech sector, but an $80 billion base means Marvell's revenue structure needs to undergo a fundamental change. The company currently relies heavily on data center and infrastructure businesses; to achieve this goal, product lines such as custom AI chips, optical module DSPs, and Ethernet switch chips all need to scale up simultaneously. Independent judgment from this site: The market's pricing of this target is far lower than that of the fiscal 2028 $20 billion guidance, because the longer the time horizon, the greater the uncertainty of assumptions. Investors should treat $80 billion as a 'stress test' rather than a short-term catalyst.
3. Over $30 EPS in 2030: A Quantitative Benchmark for an Earnings Leap
Marvell expects EPS to exceed $30 in 2030. If achieved, this would correspond to a substantial increase in earnings per share. Again, this is the company's own guidance. We cannot guarantee realization. The text should state 'if this target is achieved.' In an AI-driven semiconductor cycle, high revenue growth does not necessarily translate linearly into EPS; depreciation, R&D expenses, merger amortization, and tax rates all affect final profits